AI Profiling
Javad Kasravi
March 12, 2026
Who’s Stealing My Speed?

Agenda
- Node Communications
- NVIDIA AI Profiling tools
- Single GPU training
- Distributed Data Parallel (DDP)
- Single node training
- Multi node training
- DDP scaling
Single Node Communications
Base System
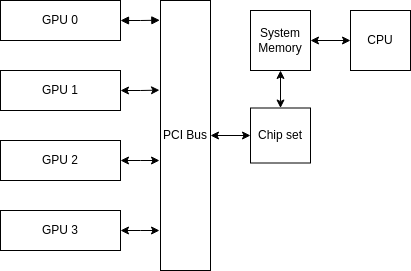
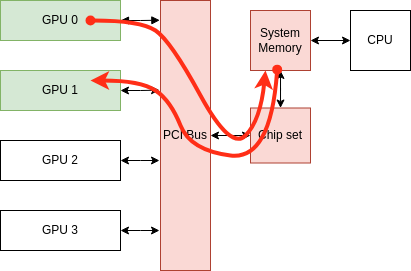
Naive communication
Data Path:
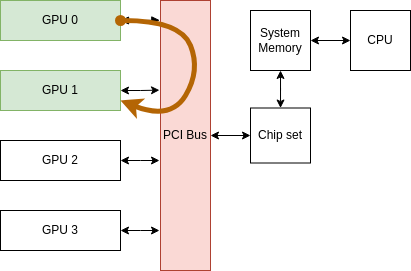
PCI Bus Peer-to-Peer (P2P) communication
Data Path:
GPUDirect P2P communication (NVLink)
Data Path
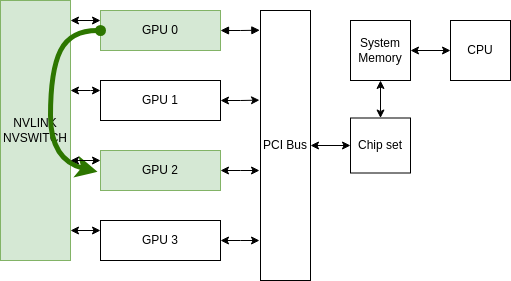
Throughput Comparison
| Communication Type | Throughput |
|---|---|
| Naive communication | ~16 GB/s per GPU 🐢 |
| PCIe Bus P2P communication | ~32 GB/s per GPU 🚗 |
| GPUDirect P2P communication | 300 GB/s total per GPU 🏎️ |
Multinode Commumications
GPUDirect Without RDMA Communication
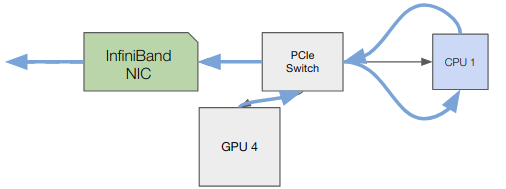
GPUDirect With RDMA Communication
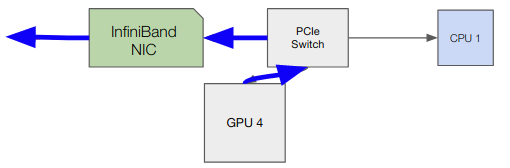
Throughput Comparison
| Communication Type | Throughput |
|---|---|
| GPUDirect Without RDMA | <50 GB/s 🐢 |
| GPUDirect With RDMA | ~ 50 GB/s per node (2 HDR InfiniBand) 🏎️ |
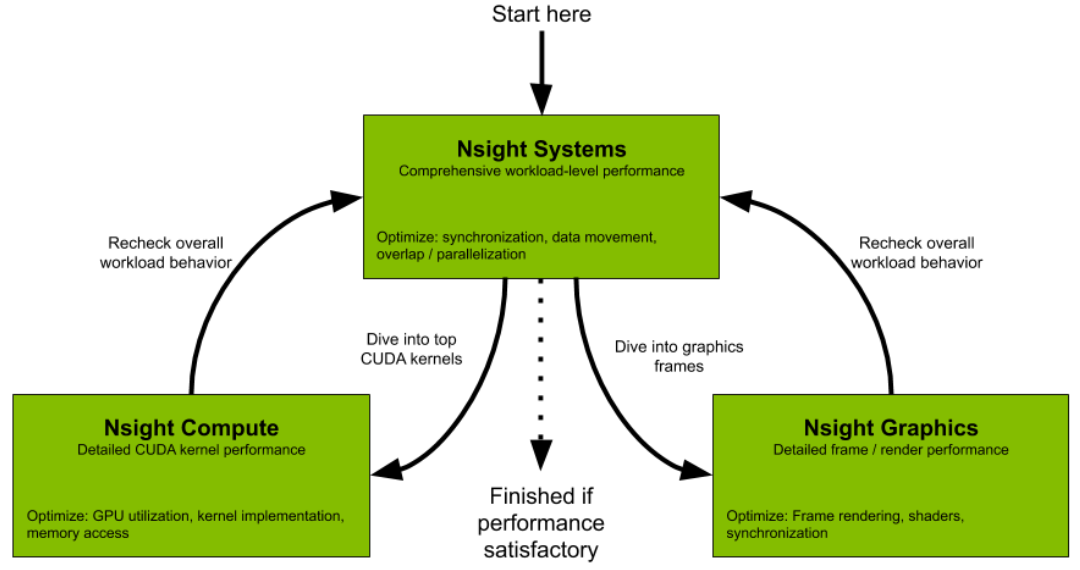
AI Profiling?
NVIDIA profiling Tools
Nsight Systems GUI
Go to the following link and download the Nsight System 2025.3.1:
Run Profiling
    srun env -u CUDA_VISIBLE_DEVICES bash -c 'torchrun \
       --nproc-per-node=gpu \
       --nnodes="$SLURM_JOB_NUM_NODES" \
       --rdzv-id="$SLURM_JOB_ID" \
       --rdzv-endpoint="$MASTER_ADDR":"$MASTER_PORT" \
       --rdzv-backend=c10d \
       --rdzv-conf=is_host="$(if ((SLURM_NODEID)); then echo 0; else echo 1; fi)" \
       --local-addr="$(if ((SLURM_NODEID)); then echo $MASTER_ADDR; else hostname; fi)" \
       --no-python ./run_profile.sh train/ddp_training.py --profile'
nsys profile \
--duration=30 \
--delay=200 \
--gpu-metrics-device=all \
--nic-metrics=true \
--stop-on-exit=false \
--trace=nvtx,cuda,osrt \
--python-sampling=true \
--python-sampling-frequency=1 \
--cuda-memory-usage=true \
--force-overwrite=true \
--python-functions-trace=profiler/config/profiling.json \
--output=nsys_logs/nsys_logs_rank_${RANK} \
--python-backtrace=cuda \
--cudabacktrace=all \
python -u "$SCRIPT_NAME" "$@"Run Profiling
Inside of profiler/config/profiling.json
We also trace the NVTX trace
for step in range(num_steps):
    with ExecutionTimer("data_loading (to Sys. mem)", profile=True) as t:
        src, tgt = next(train_iter)
    with ExecutionTimer("data_movement (to GPU mem)", profile=True) as t:
        src, tgt = src.to(device, non_blocking=False), tgt.to(device, non_blocking=False)
    with ExecutionTimer("forward_step", profile=True) as t:
        output = model(src)
    ...
Nsight Systems (Deep Learning App.)

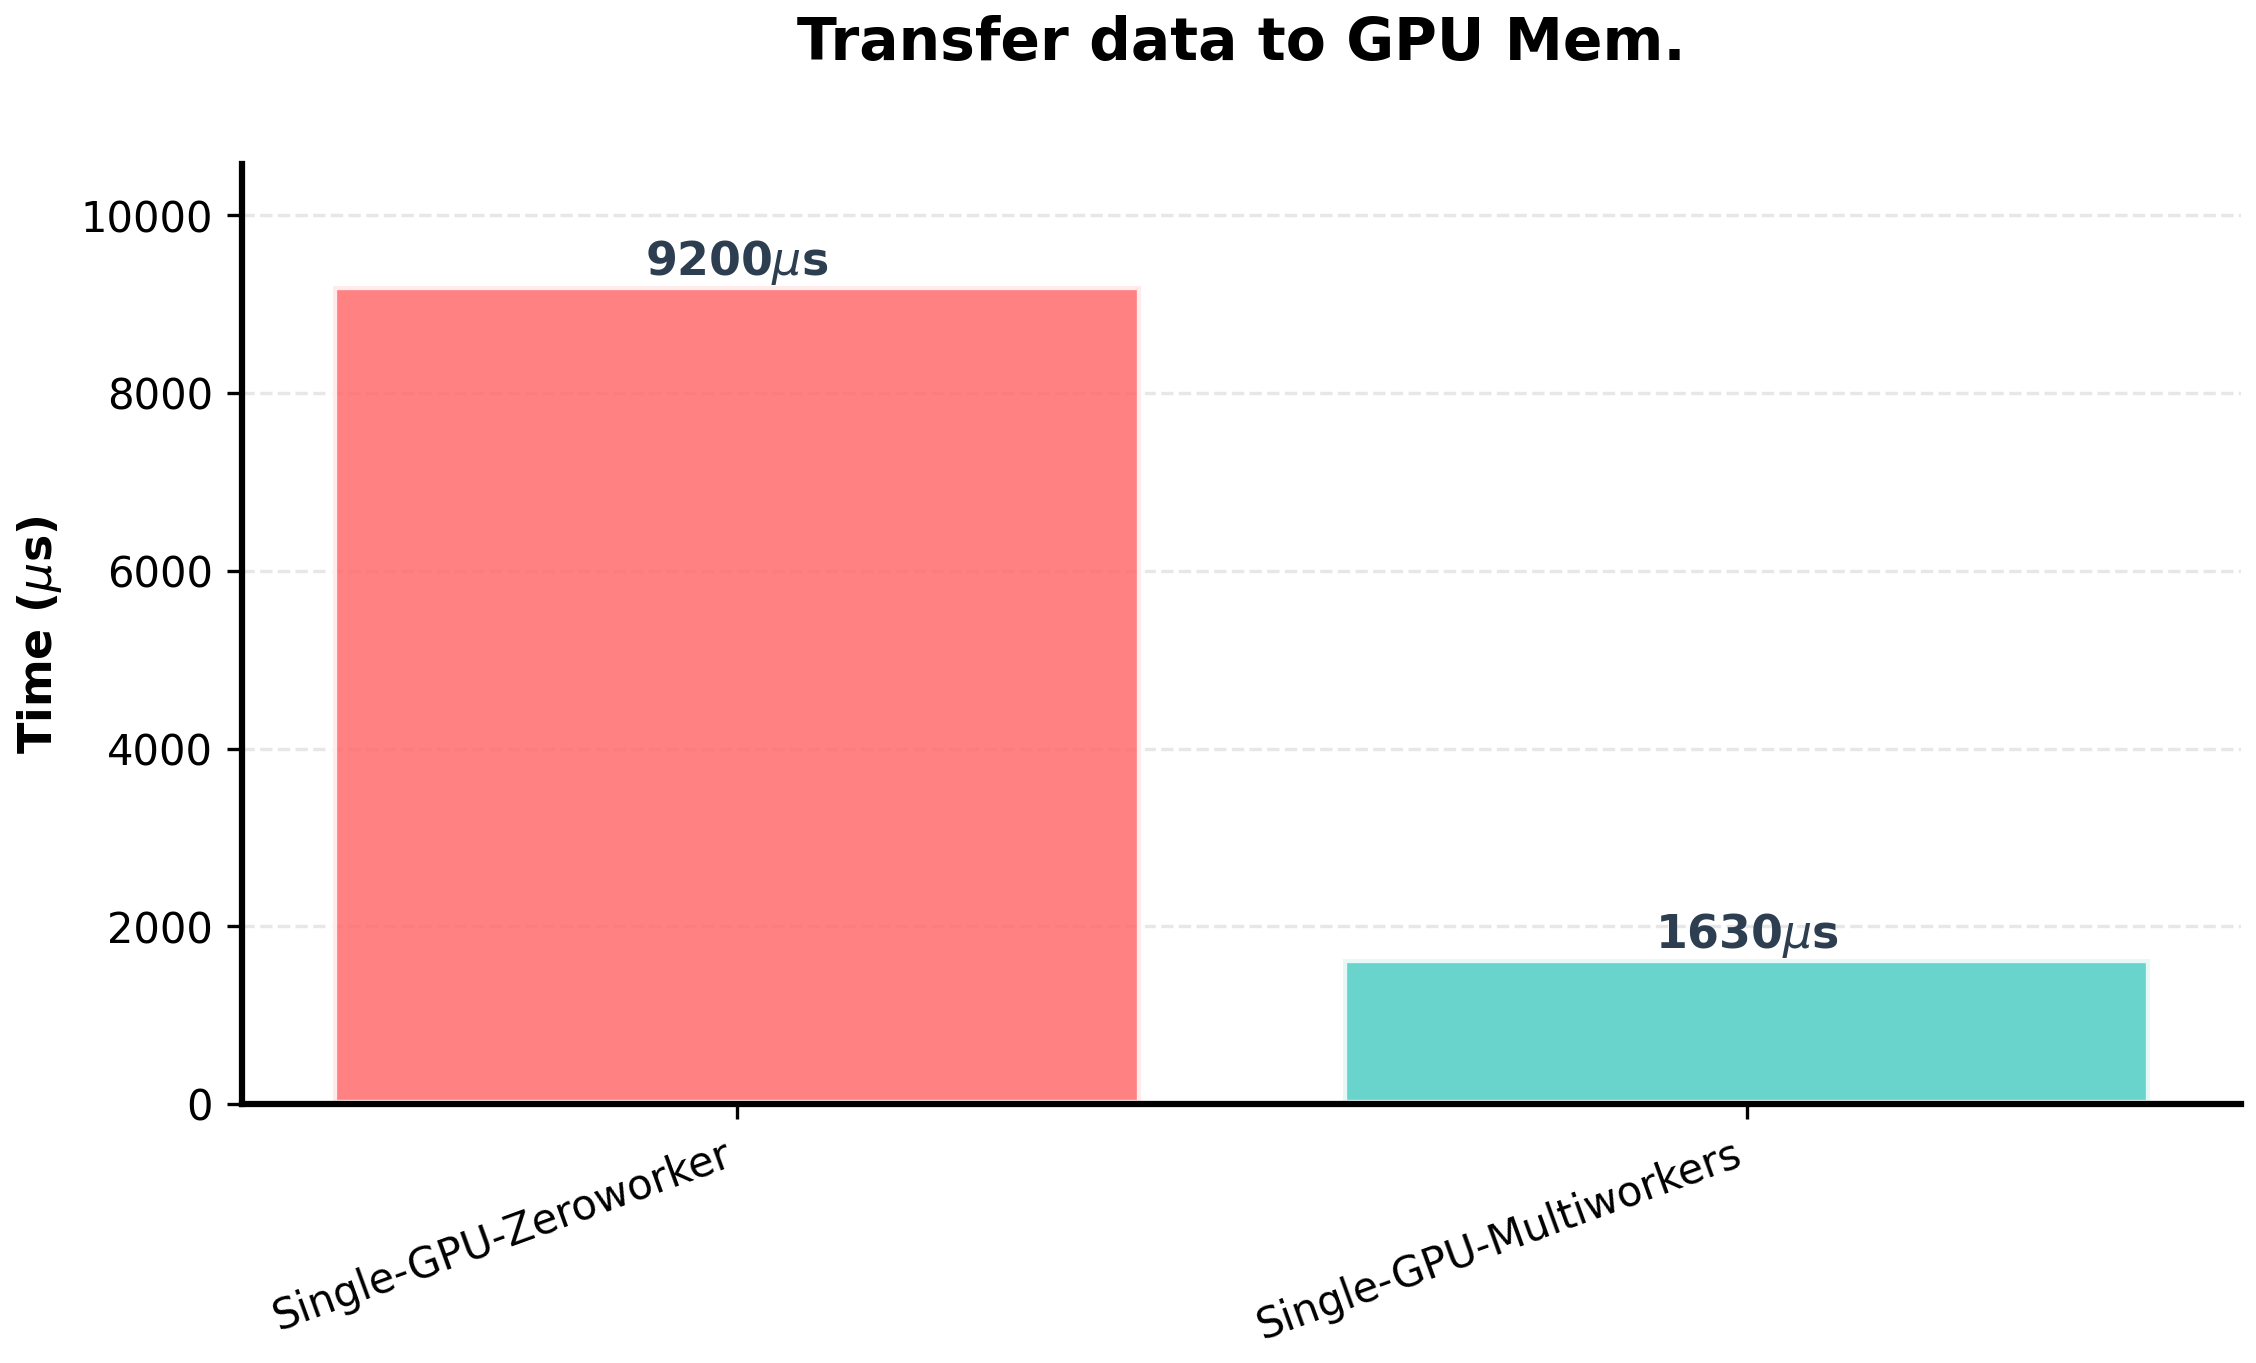
Single GPU without dataloader Worker
Only the main process transfers data to system memory.
Single GPU without dataloader Worker
Move the trace folder to your local machine by running:Use + and − keys to zoom in and out
Go to this link to answer the questions:
📘 Exercise
- Find the Python process with CUDA HW
- Find the Python thread inside the above process
- How long does it take until one iteration is finished (data transfers, forward, backward, …)?
- Which part of training takes the most time: data loading, data movement, the forward pass, or the backward pass?
- How long does it take until one data loading step is finished?
- Explore CUDA HW thread and what is the GPU peak memory?
Single GPU Multiworkers
Single GPU Multiworkers
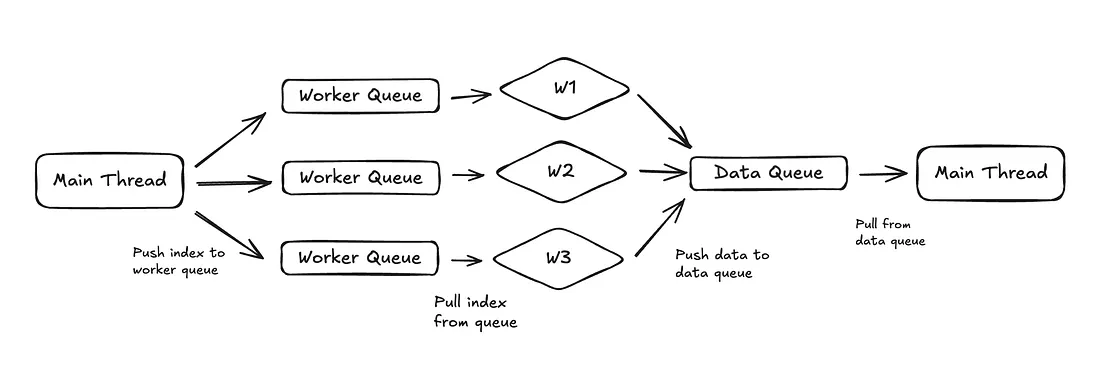
Main process send indexes to workers
- index 0 → worker 1
- index 1 → worker 2
- index 2 → worker 3
- index 3 → worker 1
Single GPU Multiworkers
Single GPU Multiworkers
Go to this link to answer the questions:
📘 Exercise
-
Find
pt_data_workerprocesses - How many pt_data_worker traces are created by Nsys?
- Which part of training takes the most time: data loading, data movement, the forward pass, or the backward pass?
- How long does it take until one data loading step is finished?
Single GPU Multiworkers
DMA (Direct Memory Access)
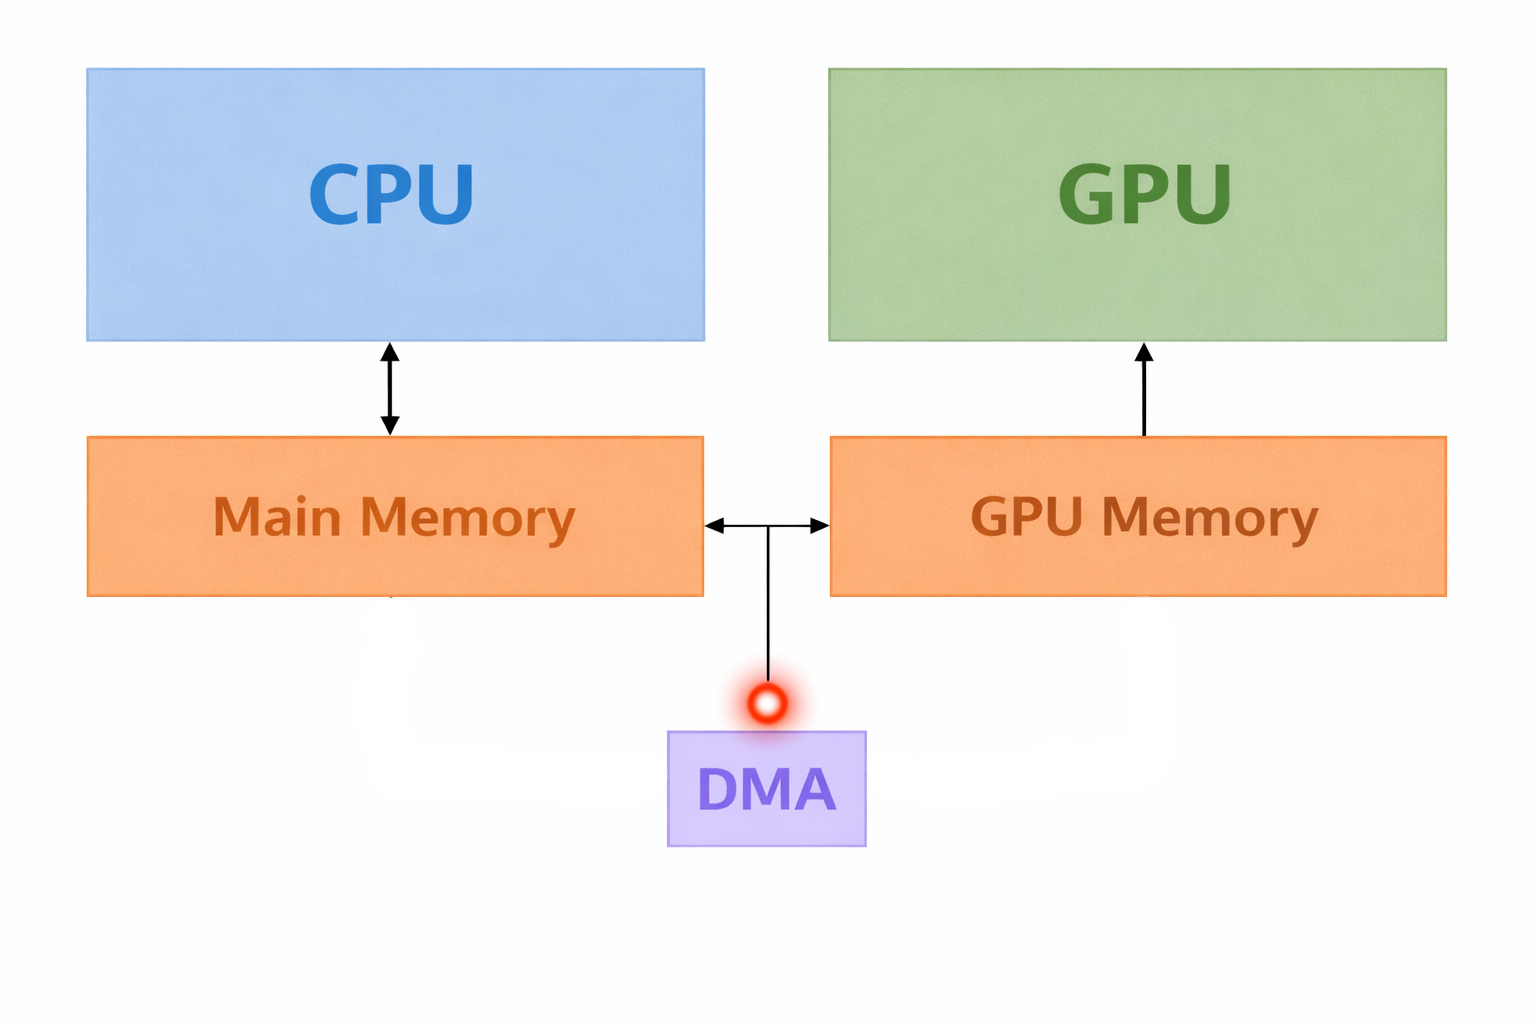
- DMA allows some hardware to access memory without involving the CPU
- Copying between CPU & GPU uses DMA
- What is the advatage of data transfer by the DMA?
- What is the problem of data transfer by the DMA?
DMA (Direct Memory Access)
-
DMA accesses memory using physical addresses.
- Cannot detect if the OS swaps a virtual page with another virtual page at the same physical address.
-
How can we prevent data corruption during DMA transfers?
- Pinning Memory!!

How does cudaMemcpy copy data from host to device?
cudaMemcpy
-
What happens during
cudaMemcpy: - Host to Device:
- The CPU copies data to a pinned memory buffer.
- DMA transfers the data from the pinned memory buffer to GPU memory.
- Device to Host:
- DMA transfers data from GPU memory to a pinned memory buffer.
- The CPU copies data from the pinned memory buffer.
- Disadvantage:
-
Every
cudaMemcpyactually involves two copies.
Memory pinning

Single GPU (Asyn. Transfer)
Single GPU Multiworkers (Asyn. Transfer)
Go to this link to answer the questions:
📘 Exercise
- Check one iteration of training (PyTorch trace)
- Which part of training takes the most time: data loading, data movement, the forward pass, or the backward pass?
- Is there any CUDA synchronization in the trace?
DDP
DDP
Trace Path:
-
Multi_GPUs/DDP/Single_node/Report_03_DDP_one_node/nsys_logs
Go to this link to answer the questions:
📘 Exercise
- Which intra-node communication is active (PCIe or NVLink)?
- Check NIC metrics (Why is there some traffic on one node?)
- Check the NCCL trace inside of CUDA HW
- How many times is the all-reduce operation called (check NCCL trace inside of CUDA HW)?
- Do the compute kernels overlap with the NCCL all-reduce operation?
DDP
Trace Path:
-
Multi_GPUs/DDP/Multi_nodes/Report_03_DDP_multi_nodes/GPU_Direct_RDMA_enable/nsys_logs
Go to this link to answer the questions:
📘 Exercise
- Which intra-node communication is active (PCIe or NVLink)?
- Check the NCCL trace inside of CUDA HW
- Do the compute kernels overlap with the NCCL all-reduce operation?
- Do you think the training will be scalable?
DDP
Trace Path:
-
Multi_GPUs/DDP/Multi_nodes/Report_03_DDP_multi_nodes/GPU_Direct_RDMA_disable/nsys_logs
Go to this link to answer the questions:
📘 Exercise
- Check the NCCL trace inside of CUDA HW
- Do the compute kernels overlap with the NCCL all-reduce operation?
- Do you think the training will be scalable?
DDP
Trace Path:
-
Multi_GPUs/DDP/Multi_nodes/Report_03_DDP_multi_nodes/NOT_IB_USAGE
Go to this link to answer the questions:
📘 Exercise
- Do the compute kernels overlap with the NCCL all-reduce operation?
- Do you think the training will be scalable?
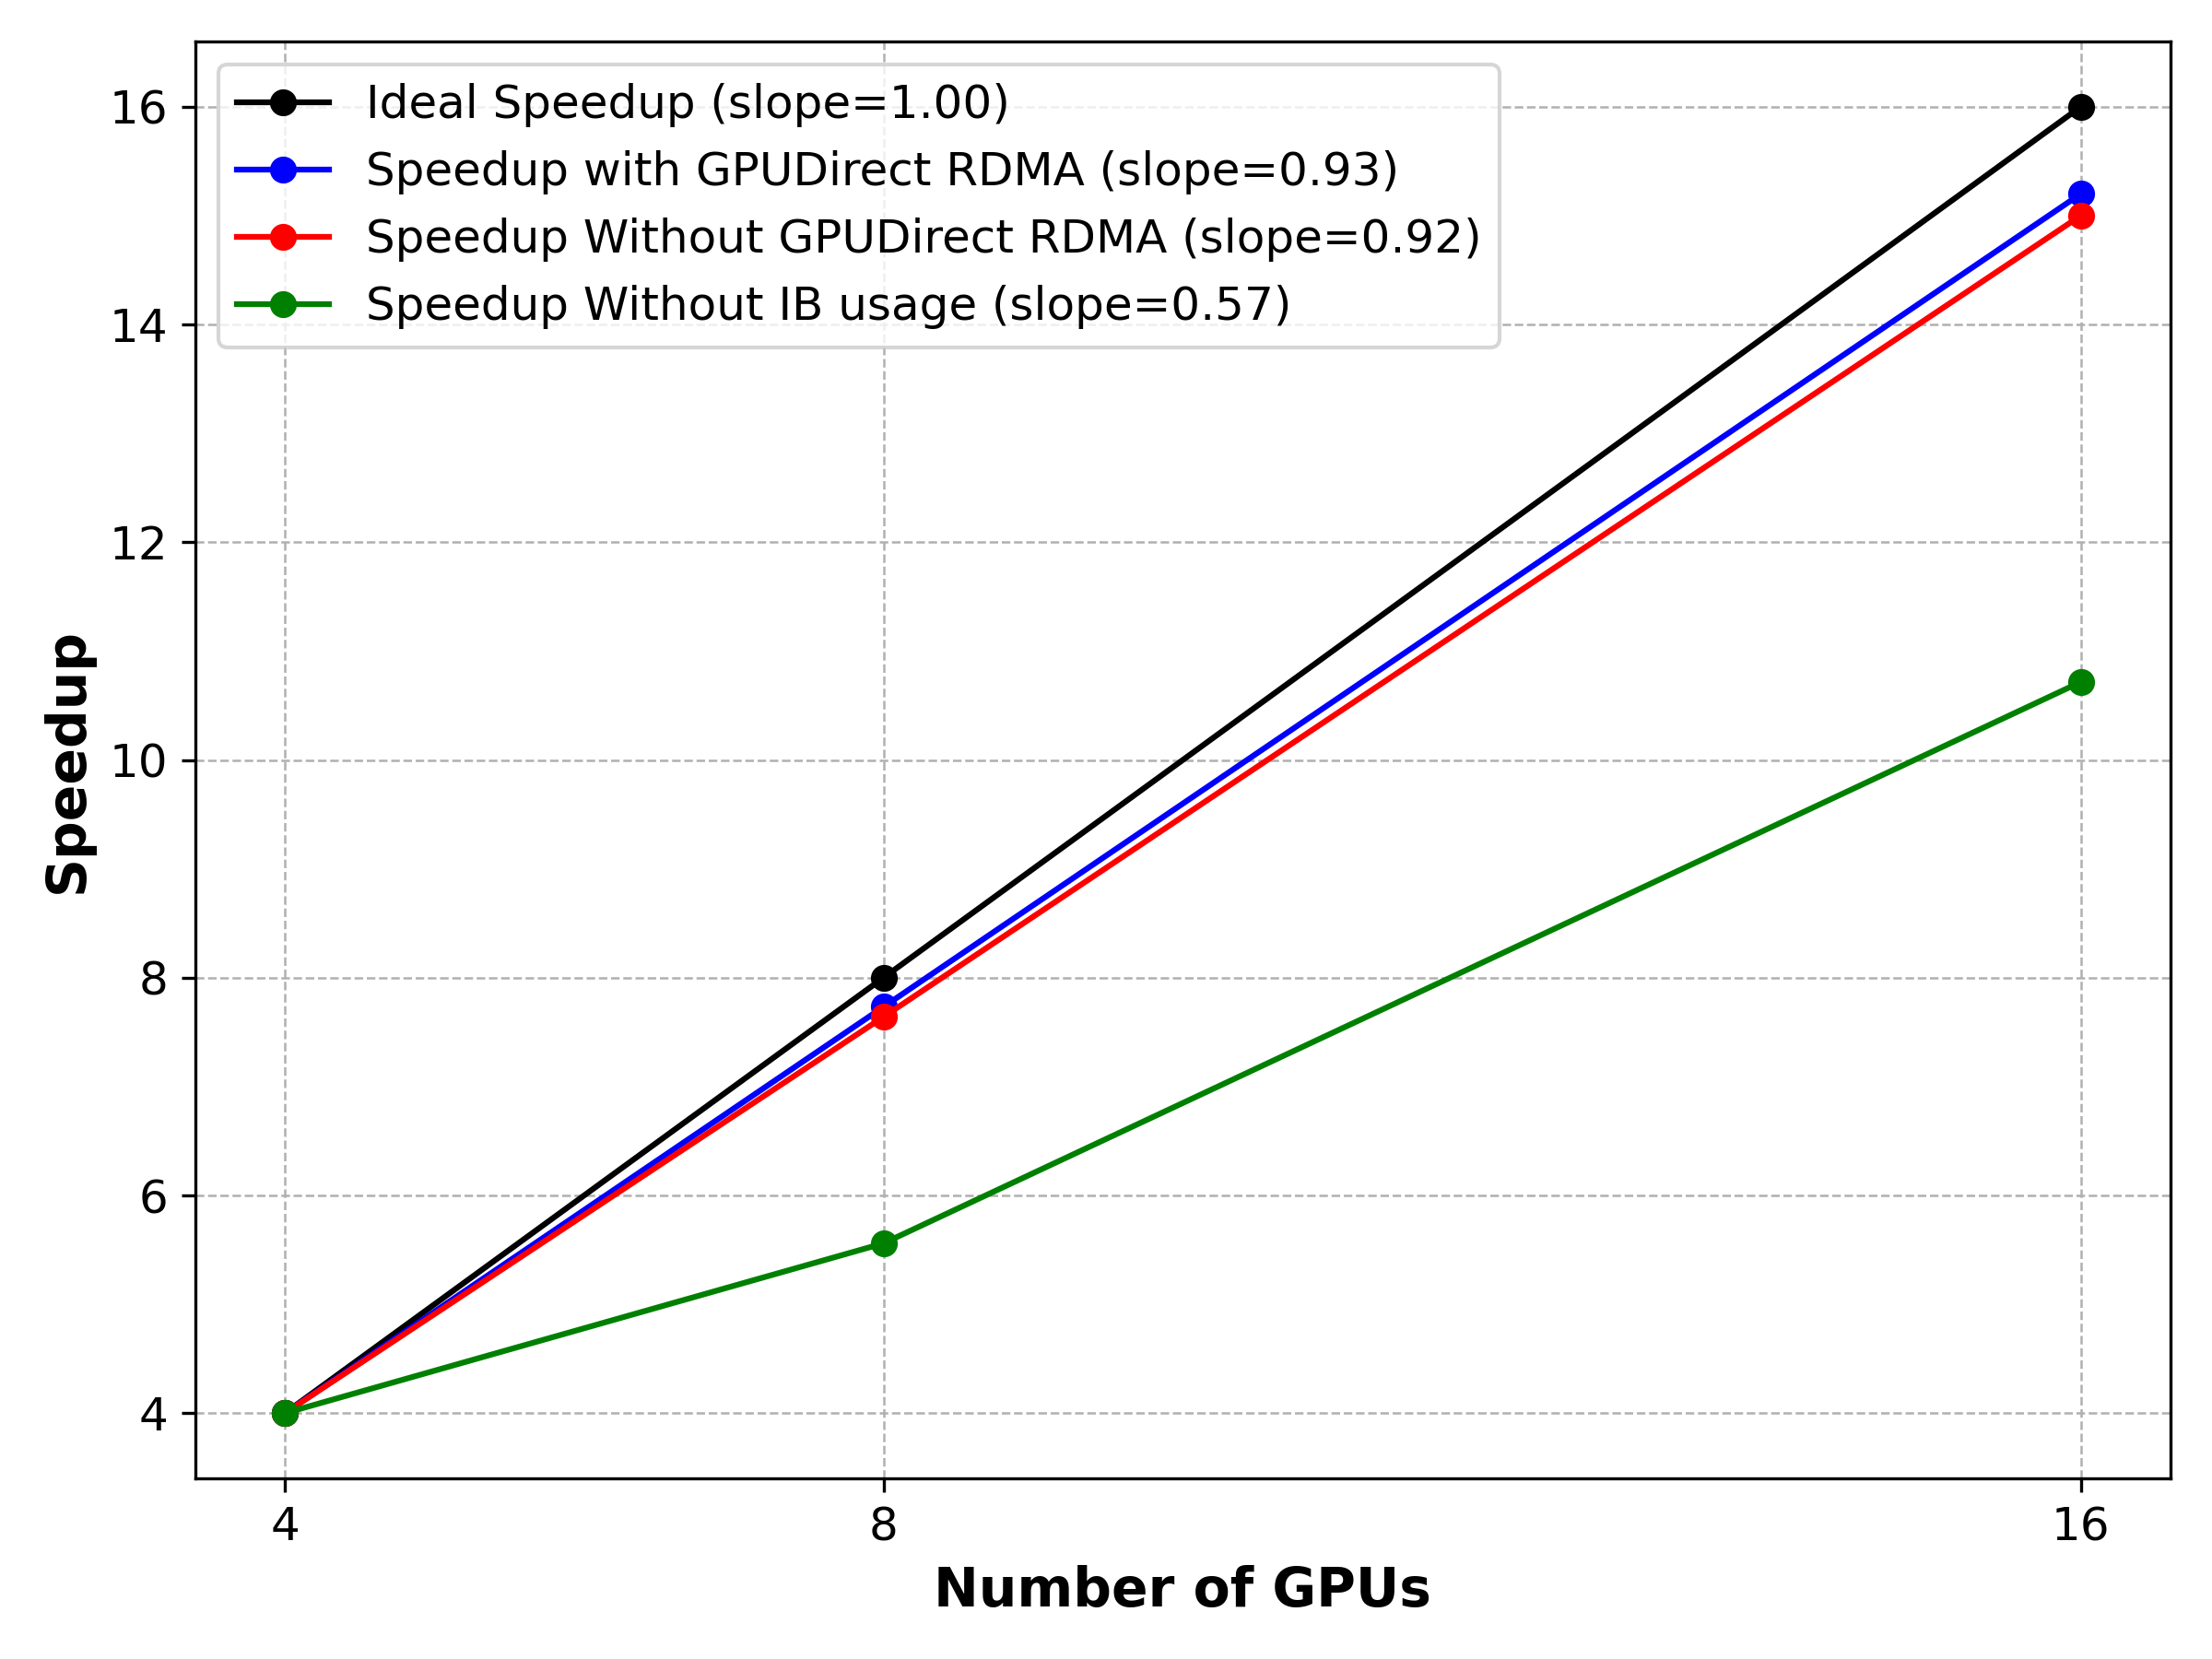
DDP scaling